HAR Series — Part 4 · ~12 min read
A quick note: If you noticed a bigger gap than usual between posts, my apologies! Things have been hectic on personal and professional fronts — in the best way possible. I recently took on a Lead Software Engineer role at Capital One and presented this work at the University for my dissertation. Both experiences served as the ultimate stress test for the ideas explored in this series. Now, back to it.
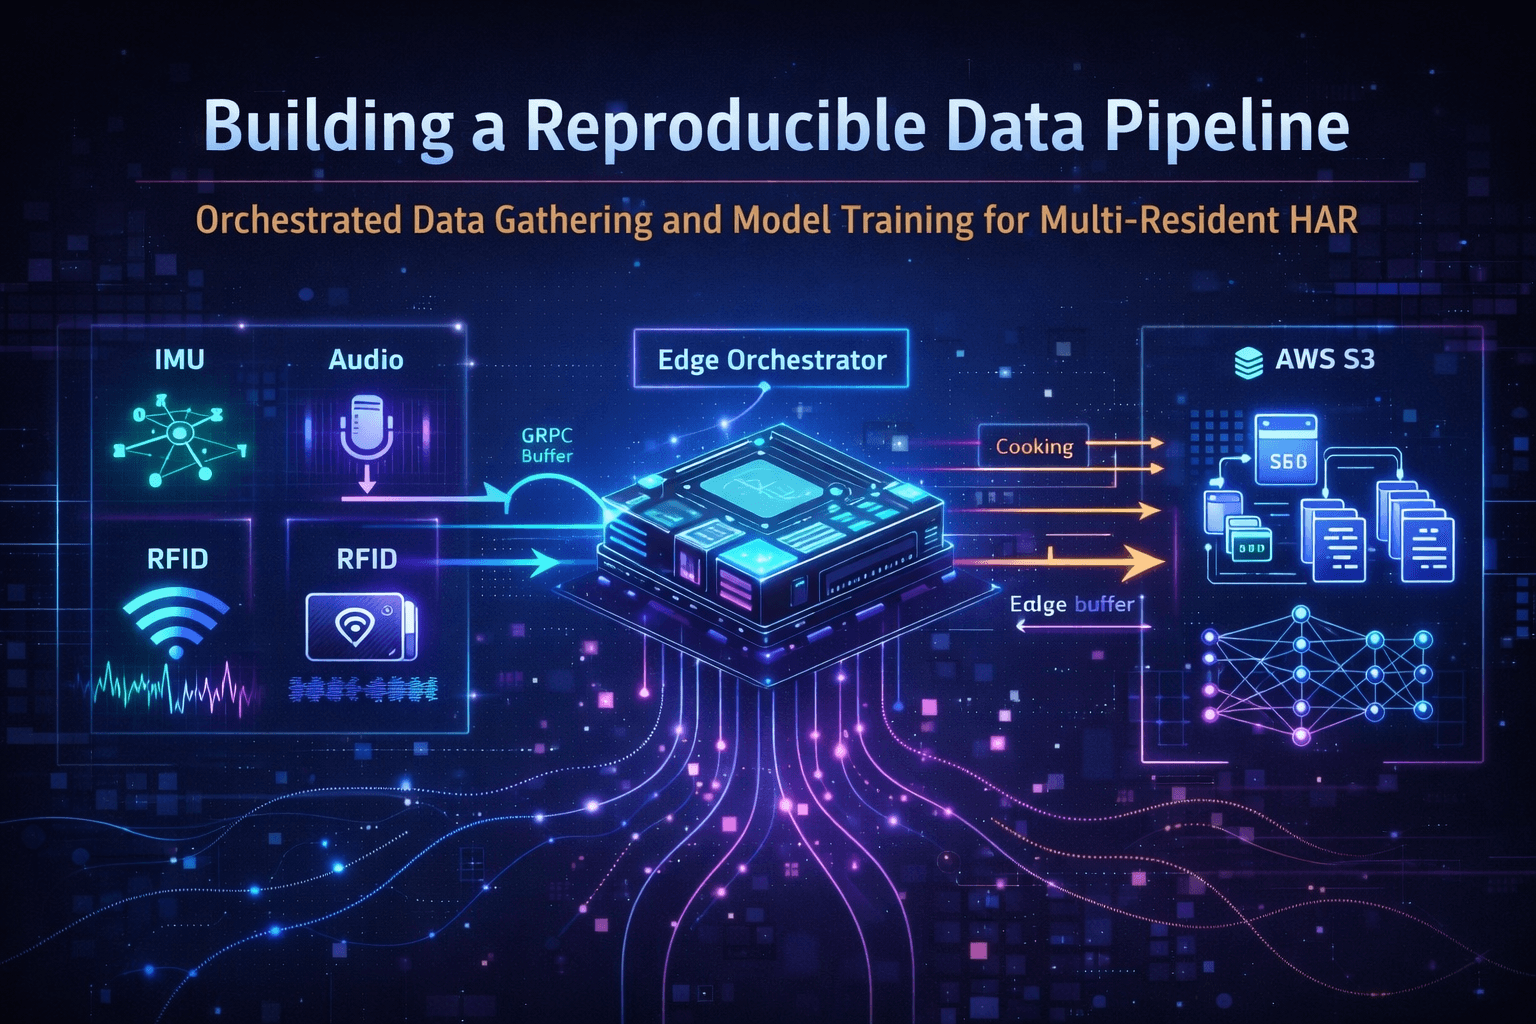
One of the most underestimated challenges in Human Activity Recognition (HAR) research is not model design — it's data acquisition at scale. For multimodal, multi-resident systems, collecting consistent, well-labeled, and privacy-aware data quickly becomes the dominant bottleneck.
In this phase of the project, I focused on designing and validating a data-gathering orchestrator mode: a system that allows researchers to boot the device, label an activity, and begin collecting synchronized multimodal data with minimal friction. This post walks through how the orchestrator was built, how data were collected over two days, and the key design decisions underlying model training.
01 — Why an Orchestrator-Centric Design?
Early prototyping revealed a familiar failure mode in HAR research: data-collection logic scattered across sensor services, ad hoc scripts, and manual synchronization steps. The result is a fragile pipeline that is difficult to reproduce, extend, or hand off to another researcher.
To address this, I designed the Edge Orchestrator as the single source of truth for everything that matters at collection time:
Sensor coordination and stream management
Activity labeling and buffering
Privacy-preserving preprocessing
Cloud upload and structured dataset generation
The key inversion of control: sensors stream continuously, and the orchestrator decides when and how to capture data. This enables two clean execution modes — Data Gathering Mode and Predictor (Inference) Mode. This entry focuses on the former.
02 — What Is the Orchestrator?
The Orchestrator is the backbone of the HAR system, coordinating data flow, preprocessing, and activity recognition across all tiers. At startup, it initiates a gRPC server that acts as the unified endpoint for all sensor services — receiving Protocol Buffer payloads and transforming them into Python objects for downstream processing. The public repository of the orchestrator can be found at the following URL: https://github.com/RodCaba/fp-orchestrator
Researchers interact with the system through a dedicated UI built with HTML, JS, and CSS, exposed via FastAPI over HTTP. A WebSocket endpoint enables real-time updates, allowing the interface to display:
Connection status of each sensor service
Currently identified inhabitants via RFID
Data batches processed in gathering mode, or the active prediction label in predictor mode

Fig. 1 — The Orchestrator UI: sensor connection status, RFID presence, and real-time stream monitoring.
03 — Data Gathering Mode: From Label to Dataset
From the researcher's perspective, the data-gathering flow is intentionally simple. The complexity lives in the system, not in the workflow:
Select an activity label from the orchestrator UI.
Swipe at least one RFID tag to declare occupant presence.
Press the start activity button.
Perform the activity naturally — no scripted behaviors required.
Let the system handle synchronization, preprocessing, and upload.

Fig. 2 — Data flow across the edge, orchestration, and cloud tiers during a gathering session.
RFID as the Collection Trigger
RFID presence acts as the implicit trigger for data collection. When at least one unique tag is detected, and the start button is pressed, the orchestrator activates audio and IMU streams, begins buffering synchronized multimodal data, and records the number of detected users as a first-class feature in every sample.
This design choice ensures that collected data always corresponds to actual occupancy and the researcher's intentional decision that an activity has started or ended — not an automated timer or environmental trigger that could introduce label noise.
Temporal Buffering and Cloud Upload
Incoming data is streamed via gRPC into the orchestrator, where it is immediately preprocessed, anonymized (no raw audio is ever stored), and held in a temporal edge buffer. Once the buffer reaches 10,000 records, the orchestrator:
This batching strategy provides network efficiency, fault tolerance, and clean dataset segmentation for training. If a cloud upload fails, the system retains the batch locally to prevent data loss.
Design Candor: During the initial S3 uploads, some IMU readings were incorrectly labeled due to a configuration error. Because the system stores files as blobs, corrections cannot be made in place — the mislabeled data must be accounted for in the data-loading pipeline at training time. This is a known limitation and a reminder that error correction in blob storage requires pipeline-level handling, not in-place edits.
04 — Two Days of Real-World Data Collection
Using this orchestrated flow, I deployed the system in a three-person household kitchen over two days of naturalistic activity. The result:
| Metric |
Value |
| Labeled data files |
610 |
| Records per file |
~10,000 |
| Total multimodal records |
6M+ |
| Processed, anonymized data |
2.7 GB |

Fig. 3 — Data in the Cloud Tier.
Crucially, this data was collected without modifying the environment or forcing scripted behaviors. Activities emerged naturally, including concurrent and collaborative actions — exactly the scenarios that challenge multi-resident HAR systems.
Making realistic data collection easy enough to be repeated and extended by other researchers was one of the core goals of the orchestrator. This dataset validates that it works.
05 — "Boot and Collect": Researcher Experience
From a usability standpoint, the system was designed to minimize setup overhead. A researcher can boot the edge device, connect the mobile IMU stream, open the orchestrator UI, and start collecting labeled data within minutes. In practice, the time from system startup to the availability of labeled data in S3 averaged roughly two minutes. This experience can be viewed in the following video:
https://youtu.be/XC-YxUs6ezs
This metric matters more than it might seem:
Dataset growth becomes incremental instead of painful
New activity labels can be added without pipeline changes
Model retraining becomes an expected, repeatable step — not a risky undertaking
The orchestrator effectively promotes data collection from an afterthought into a first-class system capability.
06 — Model Training: Design Decisions and Trade-offs
In the previous entry, I introduced the fp-orchestrator-utils package, which provides a CLI for downloading and uploading proto definitions to S3, along with a wrapper for S3 operations via boto3. This package was extended to incorporate data loading, inference modal, and training logic. The package repoitory can be found on the following URL: https://github.com/RodCaba/fp-orchestrator-utils
The DataLoader
The DataLoader class establishes a secure S3 connection via environment variables and offers two primary modes: downloading all JSON data from an S3 bucket (with optional local caching), or loading from a local directory. The class processes data into feature and label arrays, performing cleaning, transformation, and class label encoding using sklearn.LabelEncoder.
Model Architecture: Why Not One Big Network?
Rather than collapsing all inputs into a monolithic architecture, I opted for modular processors per modality. Each sensor type gets its own dedicated processor; features are then fused through a shared attention mechanism. The rationale:
IMU sensors have varying dimensionalities (orientation has 7 dimensions; others have 3)
Missing modalities can be handled gracefully by filling with zero tensors
Edge inference constraints favor modular, quantizable components
Independent processors allow targeted fine-tuning without retraining the full network
IMU Sensor Processor
Each IMU sensor (accelerometer, gyroscope, total acceleration, gravity, orientation) has its own processor instance. The pipeline: linear projection → LSTM over the time sequence → average pooling over the time dimension → final projection with dropout.
Audio Processor
Input is a tensor of mel spectrograms. The pipeline: projection from mel bands to a fixed size → two LSTM layers (first processes within-segment time, second processes across segments) → average pooling over both dimensions → final projection with dropout.
Attention as a Fusion Strategy
Not all modalities are equally informative for all activities. The attention mechanism — inspired by Nakabayashi and Saito (2024) — allows the model to learn which sensors matter most in a given context: IMU-heavy signals during motion-intensive activities, audio-dominant cues during appliance-based actions. This proved especially valuable in collaborative and overlapping activity scenarios.
# har_model.py — HARModel forward pass (simplified)

class HARModel(nn.Module):
    def forward(self, sensor_data: dict[str, torch.Tensor], n_users: torch.Tensor):
        # 1. Run each available modality through its dedicated processor
        features = []
        for modality, processor in self.processors.items():
            if modality in sensor_data:
                features.append(processor(sensor_data[modality]))
            else:
                features.append(torch.zeros(batch_size, self.imu_feature_size))

        # 2. Fuse via cross-modal attention
        attended = self.feature_attention(features)

        # 3. Concatenate fused features with RFID-derived user count
        n_users_exp = n_users.float().unsqueeze(1)
        combined = torch.cat(attended + [n_users_exp], dim=1)

        # 4. Classify
        return self.classifier(combined)
07 — Training Strategy and the HARDataset
Model training followed a conservative, reproducible workflow: data loaded directly from S3, explicit train/validation splits, best model checkpoint selected via validation accuracy, and final export to ONNX for edge deployment.
The dataset is encapsulated in a HARDataset class — a PyTorch dataset accessor designed for the open-source dataset derived from this collection effort. It includes a custom collate function to handle variable-length sequences across sensors with differing sampling frequencies. Each sample is structured as:
# har_dataset.py — sample structure

sample = {
    'features': upload_sample['features'],  # dict of sensor tensors
    'n_users':  upload_sample['n_users'],   # RFID-detected occupants
    'label':    self.labels[idx]            # encoded activity class
}
The module supports optional transformation functions that researchers can plug in per sample, making the dataset straightforward to extend without modifying the core pipeline.
Crucially, the training pipeline is repeatable: new data improves the model without architectural changes. This was a deliberate design goal from the start.
08 — What This Phase Enables
This phase marks the transition from a working prototype to a research platform — a system designed not just to recognize activities, but to support the iterative nature of HAR experimentation. Practically, this means:
Researchers can grow the dataset incrementally without rebuilding pipelines
New activity labels can be introduced organically as the research evolves
Model retraining becomes routine, not risky
The same system serves both research exploration and production deployment goals
Coming up next: Evaluation, system metrics, and edge performance trade-offs — what do they reveal about deploying multimodal HAR in real-world environments?